
4 habits to success on LinkedIn: a study of over 1,000 B2B companies
We build a content agent for B2B teams and run the free benchmark this data comes from, so we have a stake in this. We labeled each graphic to indicate if the data comes from our own analysis or the public report. A version of this piece ran in Product Market Fit, Guillermo Flor's newsletter.
Most B2B teams know LinkedIn is one of the best places to reach buyers, investors and future hires, but most of us struggle to know what to post there, and almost all of us struggle to find the time to post at all.
There's no shortage of advice, and to be frank most of it isn't very good. Anyone can share the story of a hit post or two, but that doesn't tell you whether they found a repeatable framework or just got lucky, so we went into the data to find what works consistently.
Some of what we found surprised us. At the median B2B company, about three quarters of the reactions it gets on LinkedIn each week go to the people who work there rather than to the company page. And among execs with a similar-sized following, the ones in the top tenth get about seven times the engagement of the ones in the bottom tenth.
Earlier this year, we studied 20,000+ posts from startup founders. We found that each account's reactions follow a specific distribution curve, called a log-normal, where most posts land near an account's usual number and a few run far above it. In other words, most posts reach the people who already follow you, and every so often one breaks out and puts you in front of a whole new audience, which is the post everyone is hoping for.
We used that finding, along with others from our own dataset, to build a public benchmark that tracks over a thousand B2B companies and the people who work there, refreshed every day. With that many posts the lucky one-offs average out, and what's left is the pattern that separates the companies that get heard from the ones that don't.
After doing this work we hold a fairly opinionated view, which is that the companies that win on LinkedIn get four things right. They have many people posting from more than one department (diversity), they post two to three times a week, every week (consistency), those people write things only they could have written (authenticity), and they put effort into every post, with strong images and no filler (quality).
Summary
B2B LinkedIn at a glance
223,551 posts from 1,051 B2B companies, each account measured against its own typical post
Three quarters of a company's reach comes from its people
Where a median company's weekly reactions come from
Founders and execs also get 1.66x a company page on a typical post.
1 · Diversity
Companies with four or more people posting get about 7x the reach per follower
Weekly reactions per 1,000 page followers, companies with 10K to 50K followers
People at the company posting regularly
2 · Consistency
Weekly reach keeps growing with cadence while each post gets a little smaller
Founders and execs by posts per week: median weekly reactions, and their typical post below
Posts per week · bottom row: typical post
3 · Authenticity
Personal stories do best, and the most common topic does worst
Reactions against the author's own typical post, by topic
Dashed line = the account's own typical post (1.0x)
4 · Quality
Posts with several images get about 3x what text-only posts get
Reactions against the same account's typical post, by format
Dashed line = the account's own typical post (1.0x)
Source: Imagine AI Benchmark (data through Oct 19, 2026). 1.66x, formats and typical post by cadence from the published report; 76%, posters, topics and weekly totals from our analysis on the same data.
One post tells you almost nothing. For most founders and execs, two posts in three land within one standard deviation of their typical post, and among people with 50 or more posts the best one is about 12x their typical post.
The four habits below are how a team lifts every post.
-
Diversity: five good-enough posters beat one great one. Mid-size companies with four or more people posting regularly get about 7x the reactions per page follower of companies where one person or nobody posts. Part of that is because we track more people at those companies, but even among companies where we track eight or more people, four or more posters get about 2x what two or three get.
-
Consistency: two to three posts a week is the sweet spot. Weekly reactions climb from 74 at one to two posts a week to 129 at two to three, and past three each post gets noticeably weaker.
-
Authenticity: write what only you could write. Personal stories get 1.74x the author's typical post, while generic industry takes, the most common topic, get 0.73x. People carry the reach too, since founders and execs get about 66% more reactions on a typical post than company pages do.
-
Quality: images win and filler costs. Multi-image posts get 2.11x an account's typical post against 0.71x for text only, and a post that does under half the usual tends to drag the next one down, which is the risk of posting just to hit a number.
How we measured
We measure every account by its typical post, the number of reactions an ordinary post of theirs gets, worked out from its own history so one viral post can't skew it (technically the geometric mean, using original posts at least 14 days old, at least 18 of them). People and company pages are measured separately.
The published State of B2B LinkedIn report covers 223,551 original posts from 1,051 companies, with 1,540 founders and execs, 1,266 other employees and 570 company pages that have enough history to measure. The companies are a curated set of B2B companies and the competitors and category leaders around them, so the findings describe that set rather than LinkedIn as a whole. Some figures come straight from the published report and others come from new analysis we ran on the same data with the same method. Each graphic has a caption that says where its data comes from.
One post is mostly noise
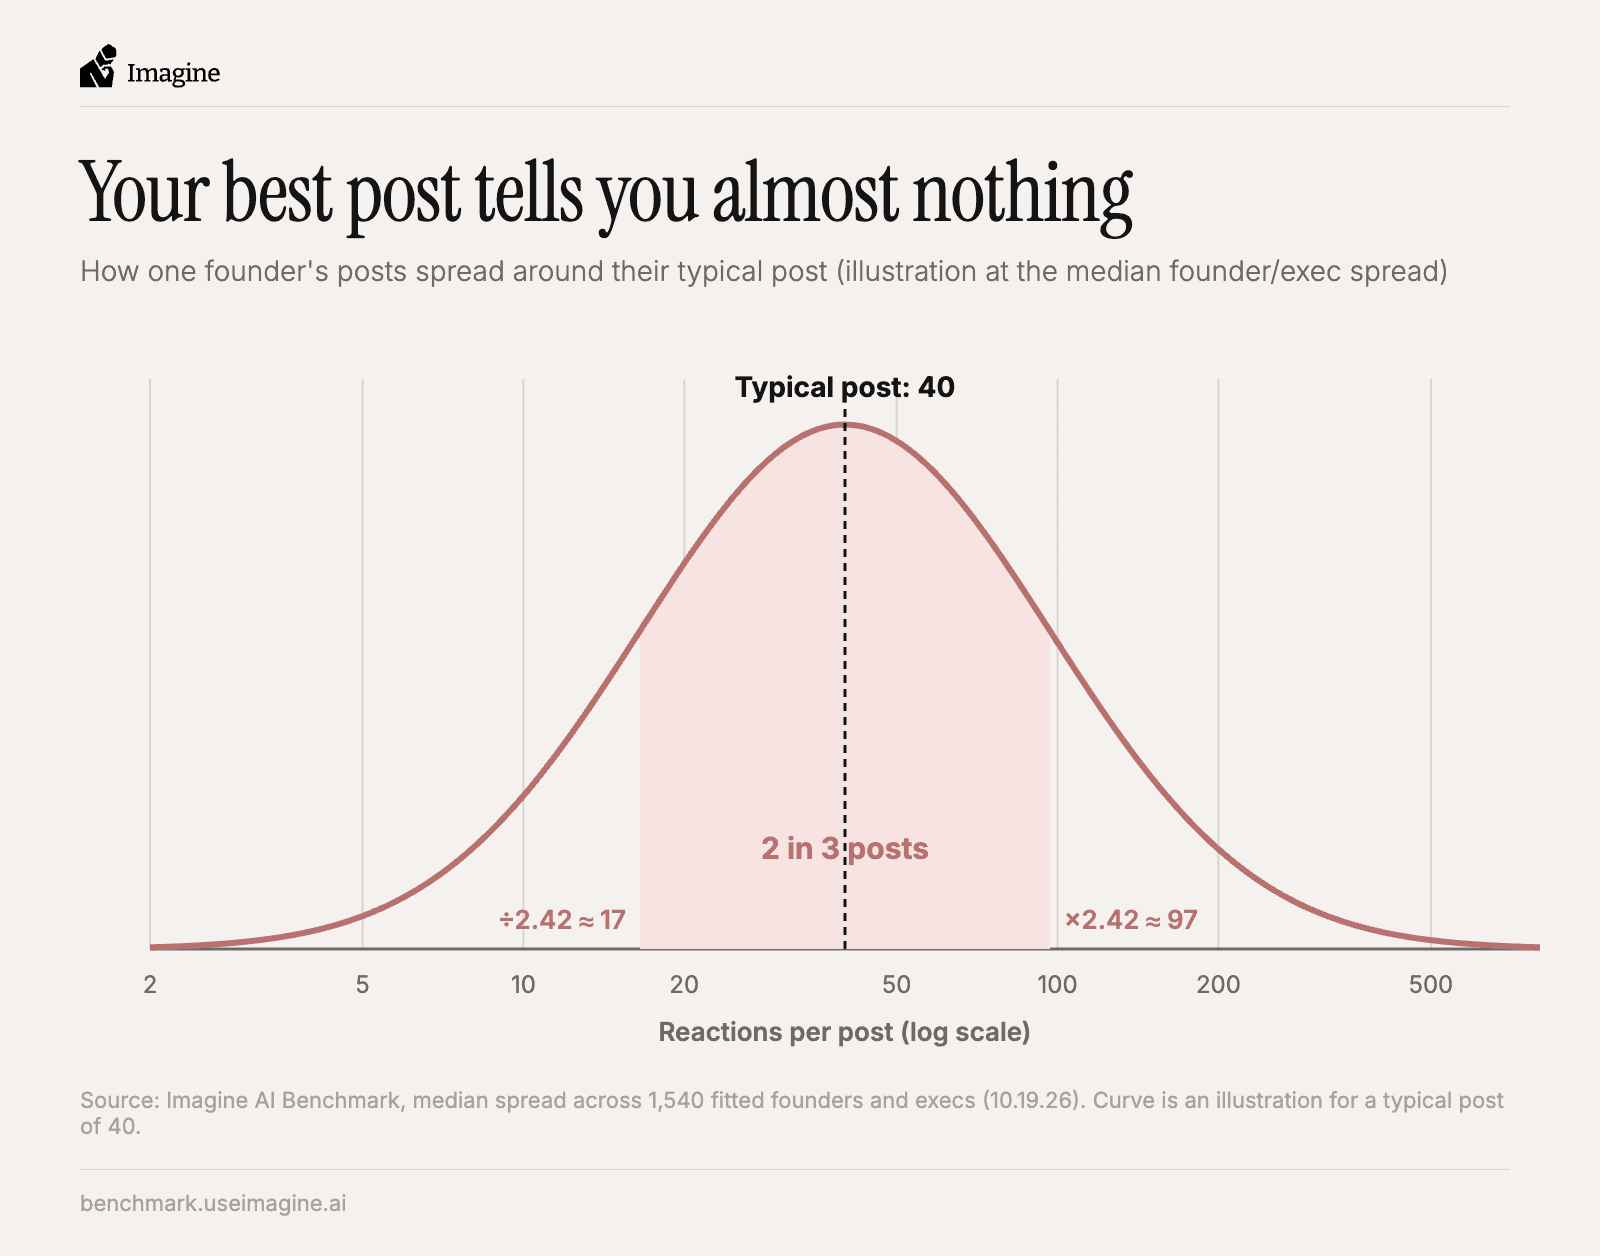
Figure 1: How far one founder's posts swing around their typical post, illustrated at the median spread for founders and execs. Source: published report.
For the median founder or exec, about two posts in three land between the typical post divided by 2.42 and multiplied by 2.42 (source). If your typical post gets 40 reactions, a perfectly ordinary post can get 17 or 97 without anything about you changing, and one post in six will beat 97 by chance alone. In statistical terms, that range is one standard deviation either side of the typical post on a log scale, so most posts simply do about what that person usually does. Among founders and execs with at least 50 posts, the best one gets a median of about twelve times the engagement of their typical post, so anyone judging an account by its best post is off by about ten times.
This randomness is why we think copying last week's winner is the wrong instinct, because nobody can pick which post breaks out. A lot of luck goes into a viral post, so it doesn't make sense to over-optimize on what got lucky in the past. Instead, a company can shift its whole curve, and the rest of this piece outlines how.
People carry the reach
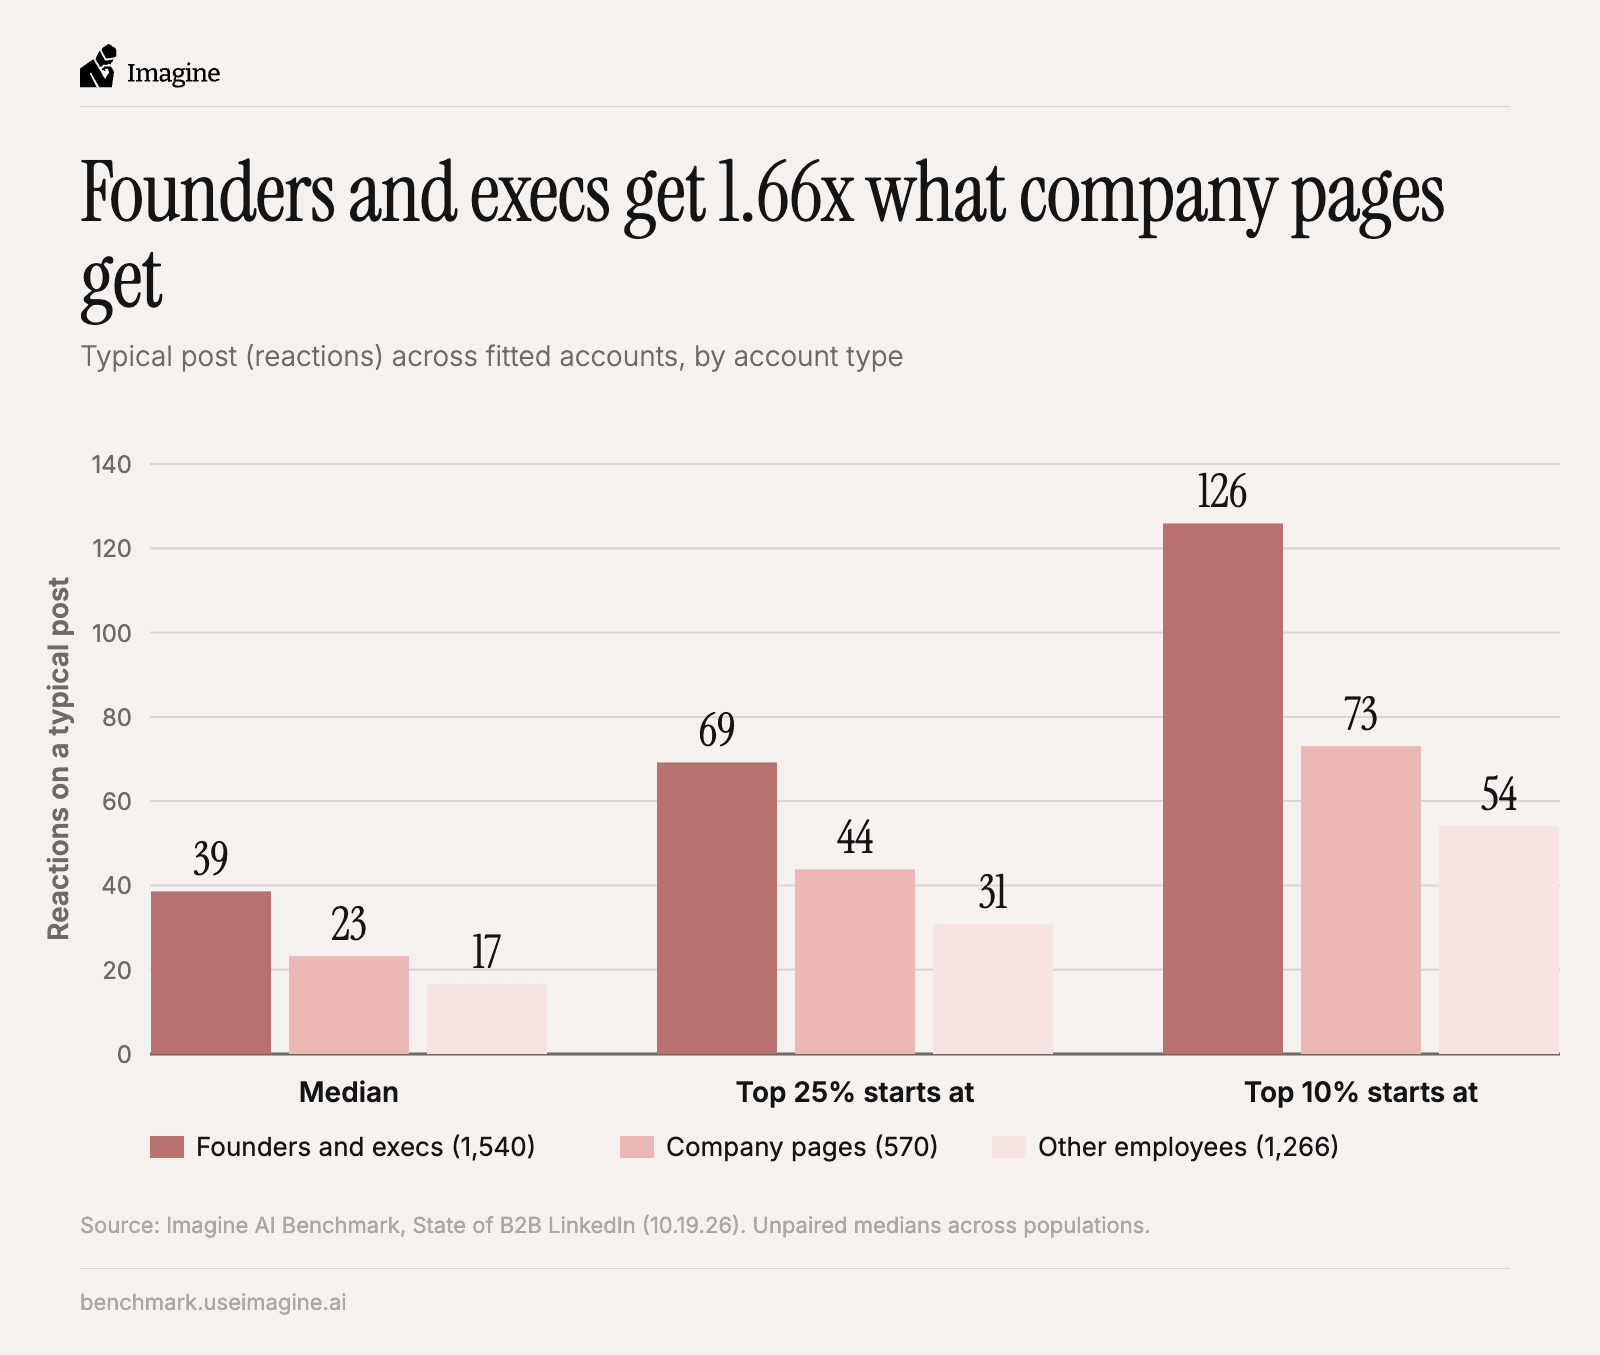
Figure 2: Typical post across every account we can measure, by account type. These are medians across separate groups, so they don't compare any one founder with their own company page. Source: published report.
The median founder or exec gets 39 reactions on a typical post and the median company page gets 23, which is the 1.66x gap in the published report (38.6 against 23.2 before rounding). Employees who aren't execs sit at 17, and the pattern holds further up the curve, where a top-10% founder or exec starts at 126 and a top-10% page at 73 (source). In short, execs do better than company pages, and company pages do better than other employees.
Those are per-post numbers, though, and for a marketing team the number that matters more is the total, meaning where a company's attention actually comes from each week. So we added up each company's weekly reactions across its page and the people we track there. The median company gets about 76% of the total from its people, which makes the page the smaller of the two channels for most companies.
Part of the reason is that LinkedIn is already full of ads. A post from a brand account is hard to tell apart from one, while a person writing in their own voice reads like a person, and that cuts through.
Teams beat individuals
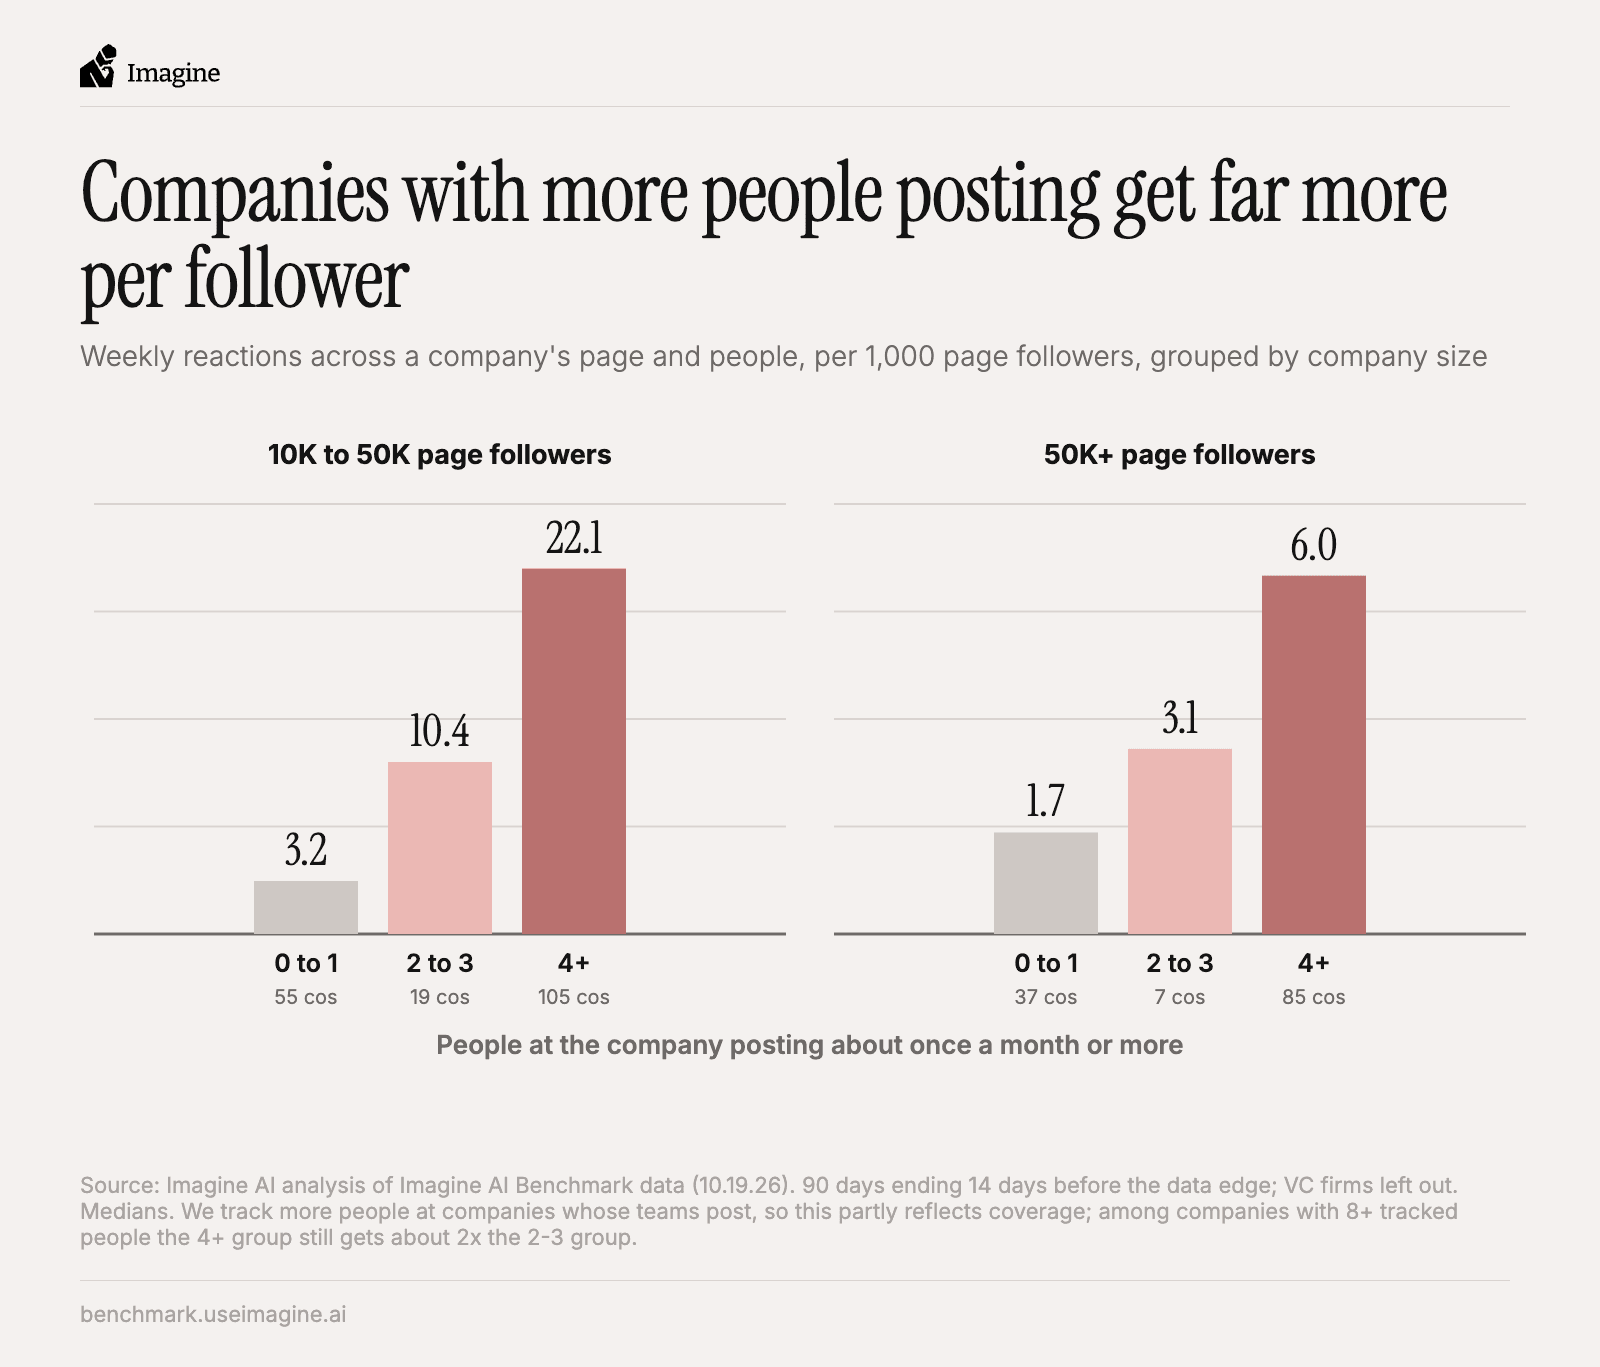
Figure 3: Median weekly reactions across a company's page and the people we track there, per 1,000 page followers, grouped by company size and by how many people at the company post about once a month or more. Source: our analysis.
The finding we care about most comes from companies with 10,000 to 50,000 page followers. The ones with four or more people posting regularly get about 22 reactions a week for every 1,000 page followers, against about 3 for companies where at most one person posts. That is roughly seven times the reach from the same size audience, and the largest companies show the same shape. Some of that gap is just that we track more people at those companies, a median of 28 against one at the others, so we also compared only companies where we track at least eight people. There, four or more regular posters still get about twice as much as two or three, and the company page itself does better too, at about 4 reactions per 1,000 followers against about 1. The individuals at solo-poster companies are often strong posters themselves, so the gap is about how many people show up more than how good each one is.
Which people post matters too. We also grouped companies by how many departments their regular posters come from (founders and execs, marketing, sales, engineering, product and operations). In that same size band, companies with three or more departments posting get about four times the reactions per 1,000 page followers, about 23 against under 6 when the posting comes from one department or none. A company where only the founder or only the marketing team posts is leaving reach on the table.
We think this happens because there are many lenses a company can tell its story through, and not every lens appeals to everyone. Marketers go on LinkedIn to learn about marketing and might follow your CMO, but they probably won't follow your VP of Engineering, who mostly posts about new AI developments, and engineers are the other way around. You need a broad mix of voices to reach a broad audience.
The other question we get at this point is why you can't just do all of this from one account. We haven't run a clean test of that, so this part is our read, but one account that tries to cover everything tends to lose people, because someone who follows you for sales advice probably isn't there for your HR posts. Having several people post lets each reader opt into the voice that's most relevant to them, and the department numbers above point the same way.
One caveat on how we count. We find people by watching who posts, so we track more people at companies whose teams are already active, which inflates their totals, and that is why we ran the check above on companies where we track at least eight people. The direction holds there and lines up with everything else in this piece, and it matches what we see at one of the top three companies on the leaderboard, where a co-founder plus the heads of growth, marketing and sales all post at a top-tier level.
Same audience, about 7x apart
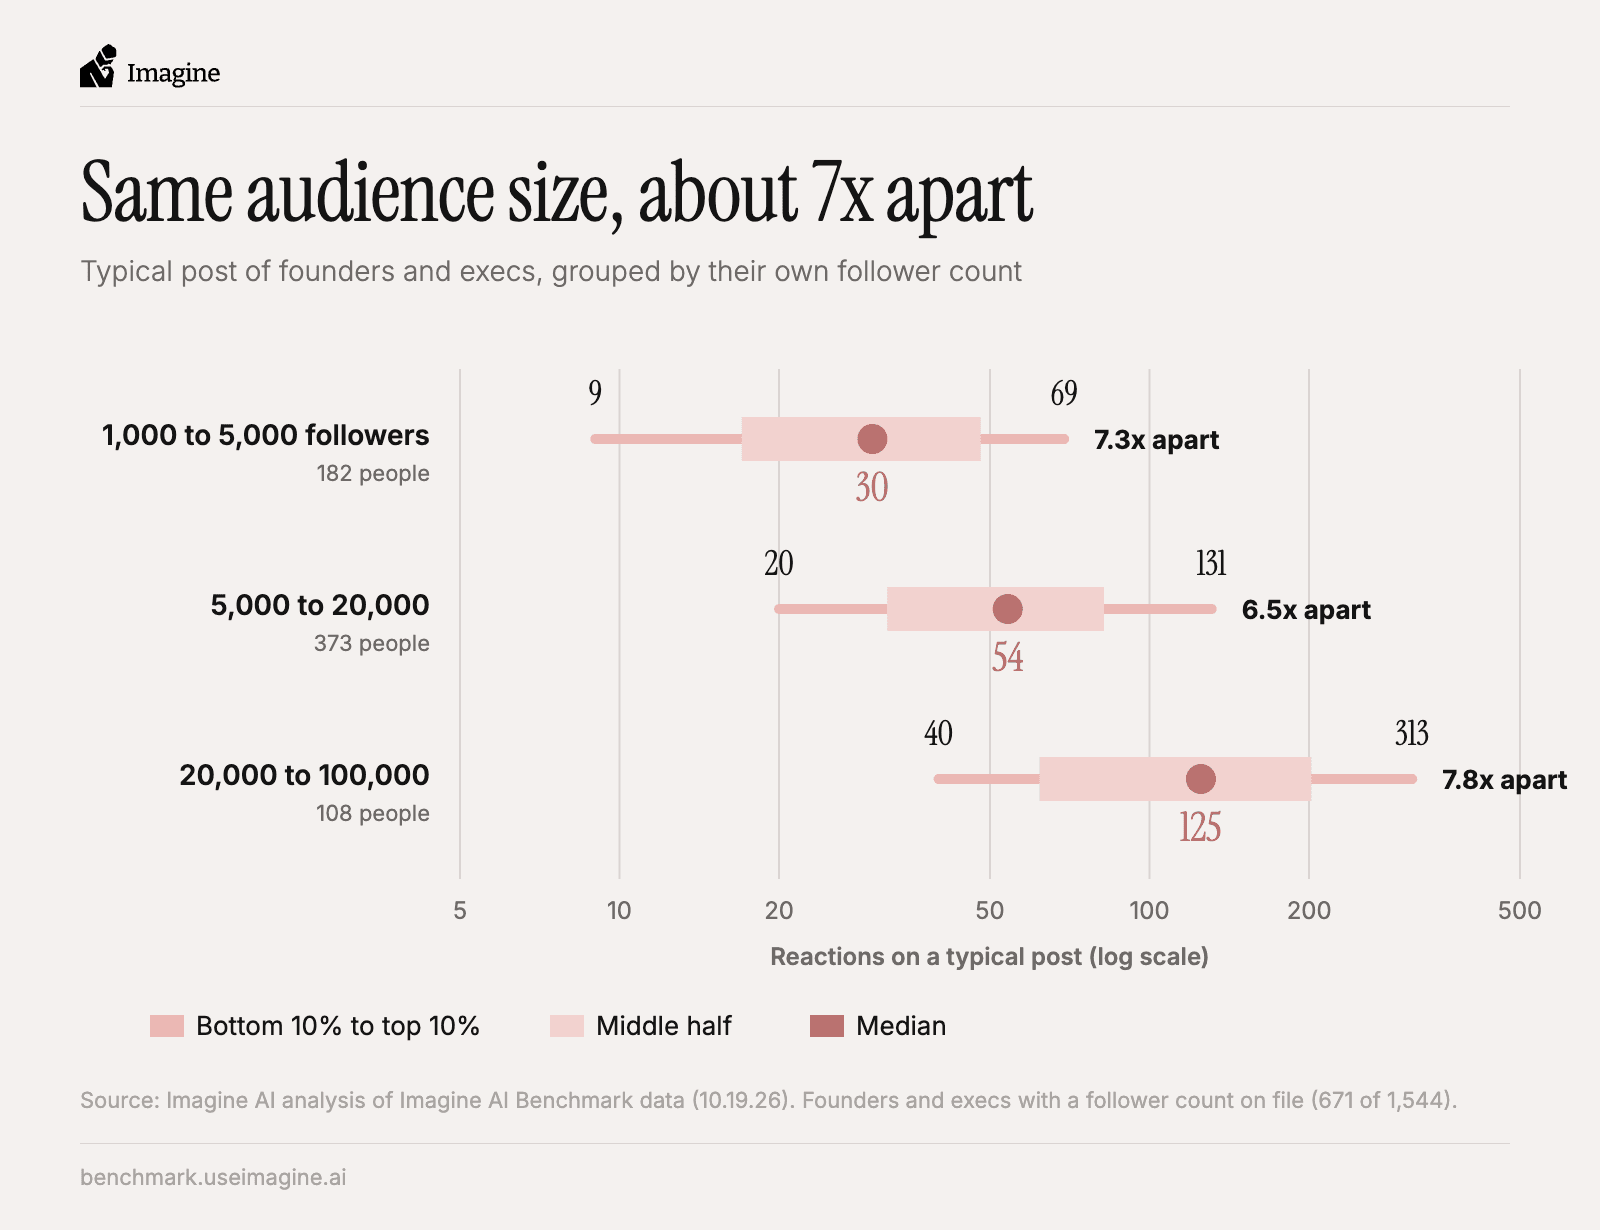
Figure 4: Typical post of founders and execs grouped by their own follower count, showing the bottom 10% to the top 10% in each group. Source: our analysis, on the 671 founders and execs with a follower count on file.
One concern we hear a lot is "aren't you just measuring someone's existing audience?", and that's fair, because a bigger audience almost always gets more engagement. The median founder or exec with 20,000 to 100,000 followers gets 125 reactions on a typical post, against 30 for people with 1,000 to 5,000. But even with audience size held still, the gap between top and bottom performers is huge. Among people with 5,000 to 20,000 followers, the most common range in our data, the top 10% get about seven times what the bottom 10% get, 131 or more reactions on a typical post against 20 or fewer, and that ratio is roughly the same in every band.
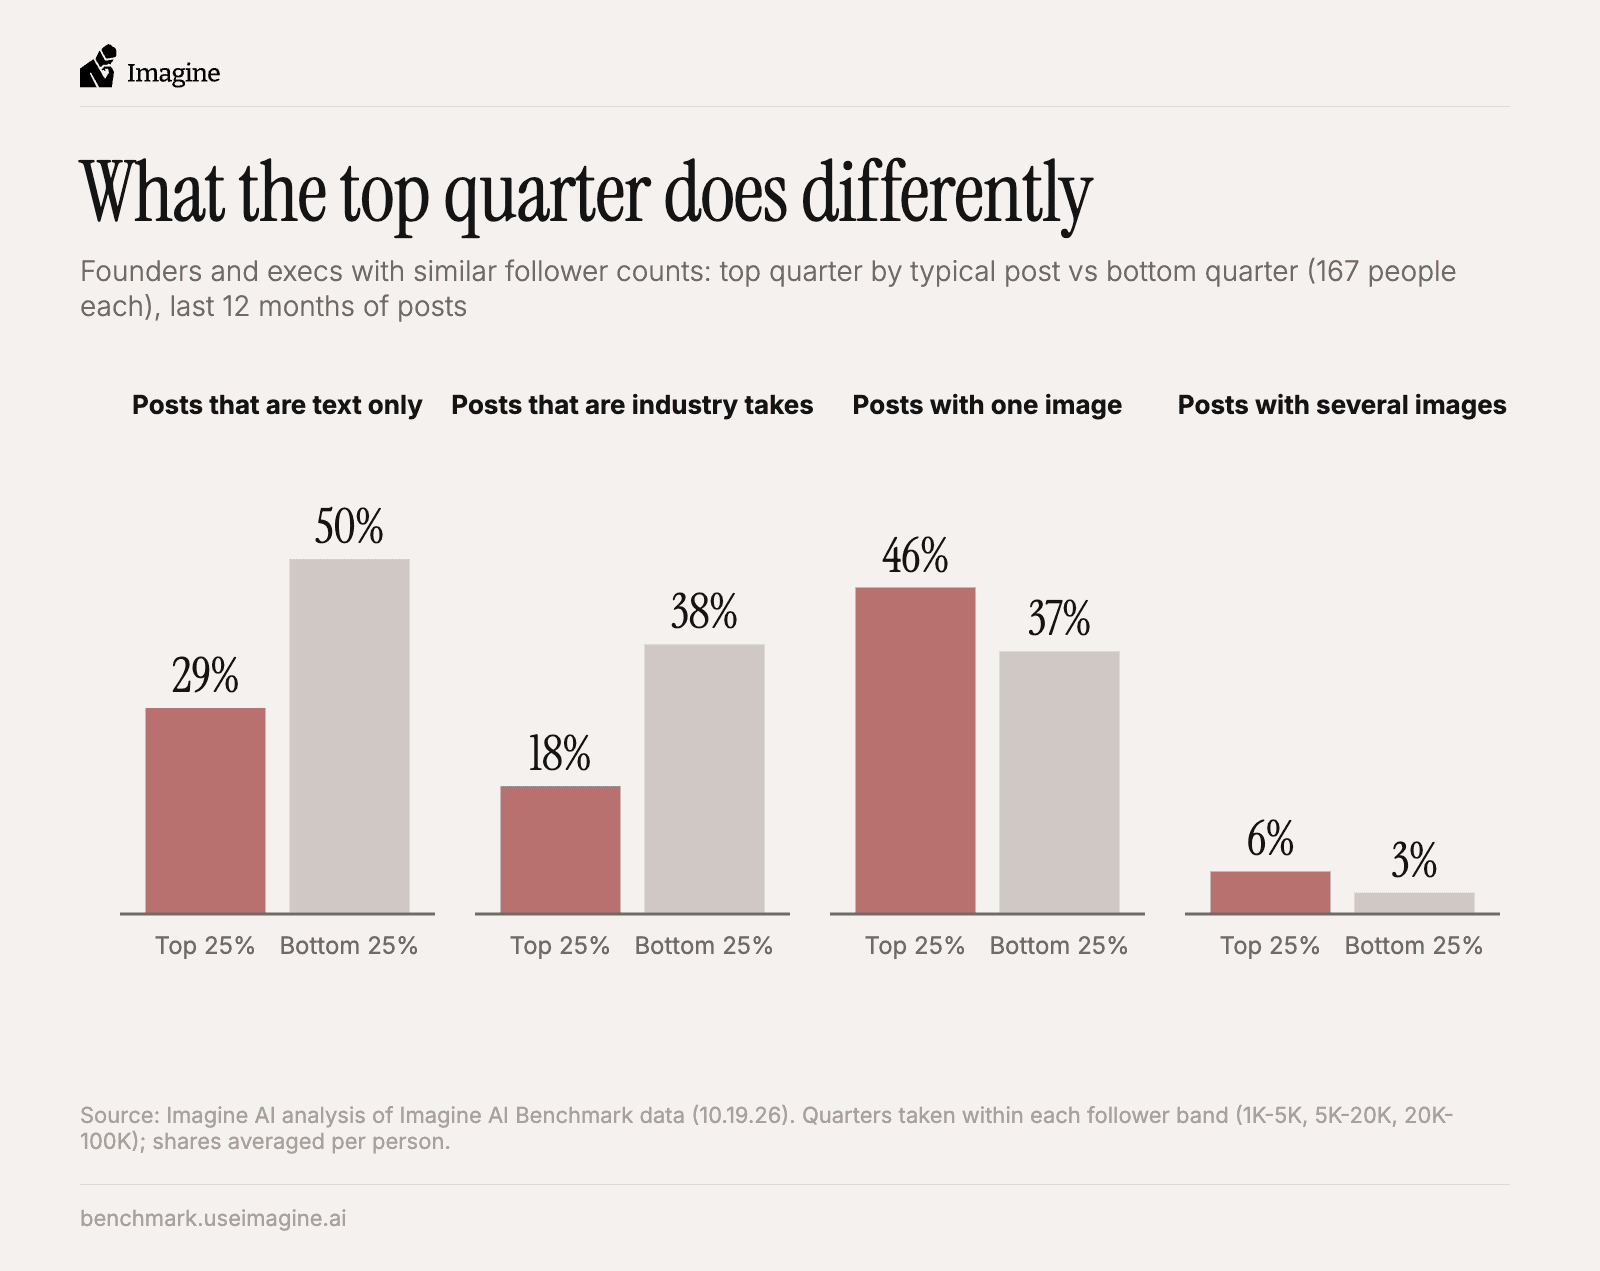
Figure 5: Founders and execs with similar follower counts,comparing the top quartile by typical post with the bottom quartile (167 people each), last 12 months of posts. Source: our analysis.
Here is a closer look at that gap, comparing the top quartile with the bottom quartile inside each follower band. It comes down to what people post, and images are the easiest place to start. From the same account, a post with one image gets about twice the reactions of a text-only post (1.44x against 0.71x of its typical post, Figure 6). Yet the bottom quartile posts text only 50% of the time against 29% for the top quartile, so they're almost twice as likely to skip the image. The top quartile also posts several images in one post about twice as often, and industry takes make up 38% of what the bottom quartile posts against 18% for the top. Within each band the top quartile still has somewhat more followers (a median of about 10,300 against 7,300), so this is a rough control, and that difference is far too small to explain a gap this size.
What to post: images, and moments only you have
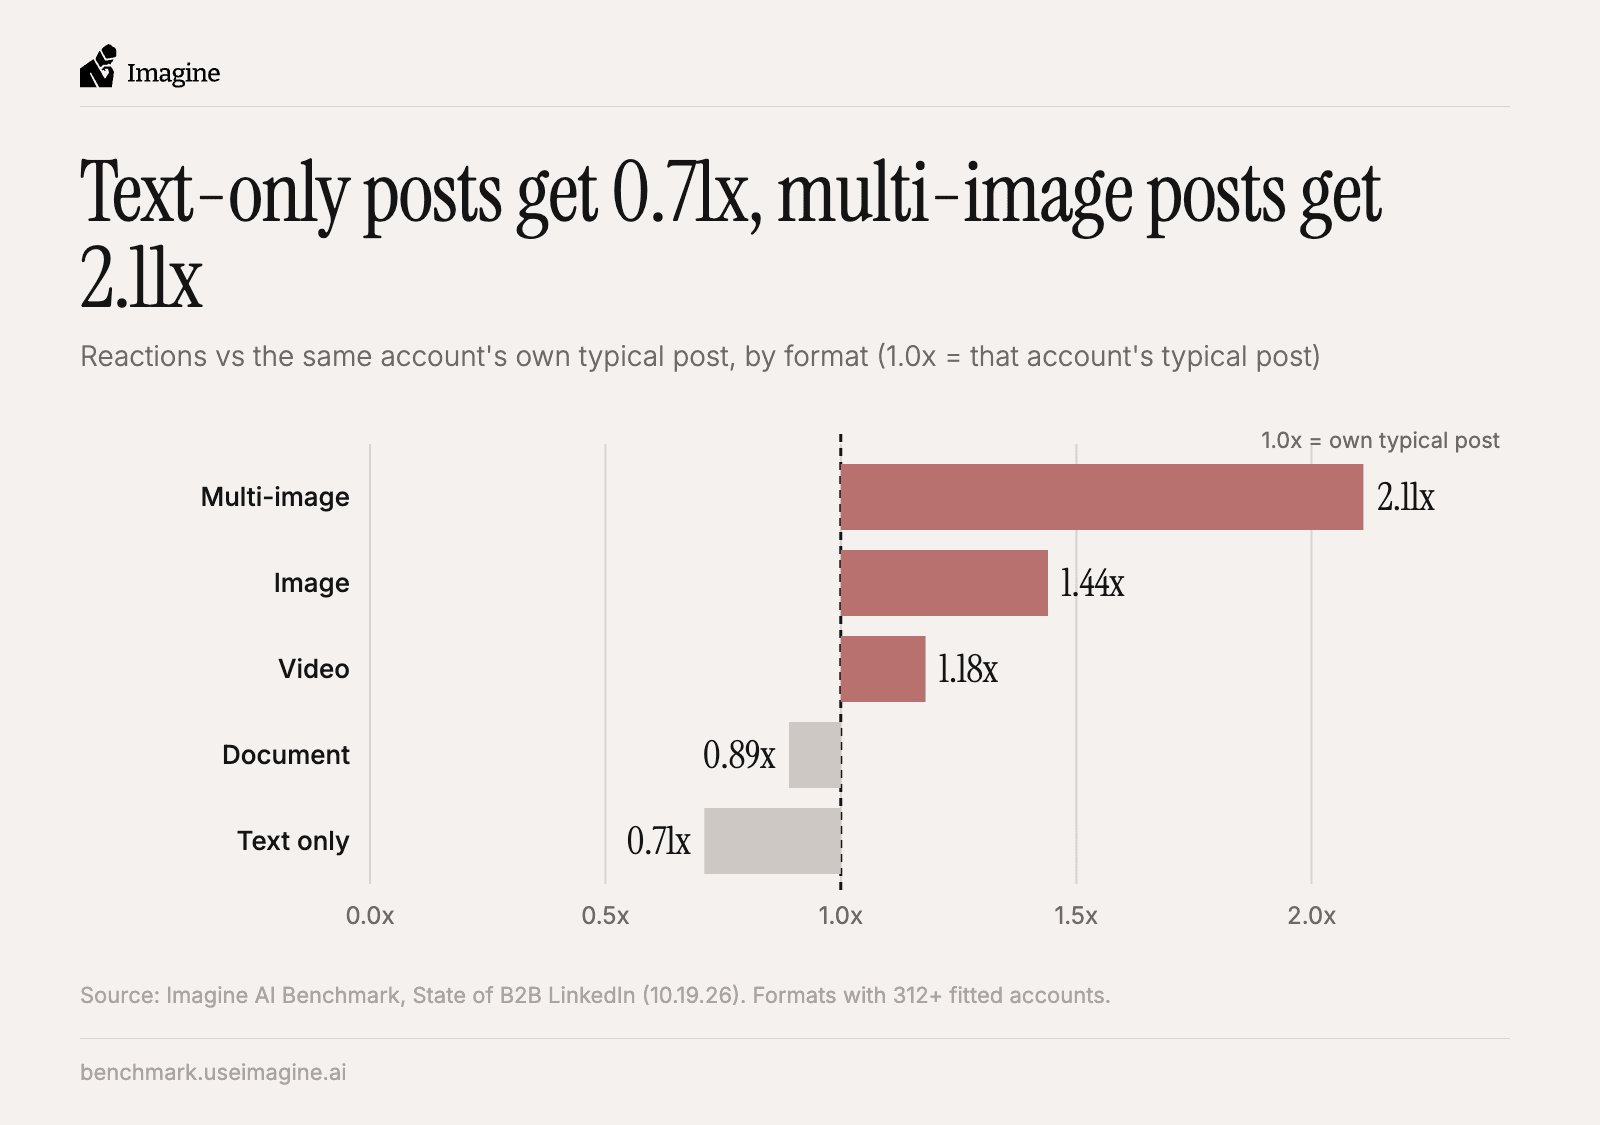
Figure 6: Reactions on a post against the same account's own typical post, by format, where 1.0x is that account's typical post. Source: published report.
Because this comparison measures every account against itself, audience size drops out almost completely, since nearly the same followers who saw yesterday's text-only post are the ones seeing today's post with a graphic. When the same account posts several images in one post it gets 2.11x its own typical post, a single image gets 1.44x and a text-only post gets 0.71x, and text only is also the most common format, at 88,002 of the posts we measured by format (source). The multi-image result also holds once you set aside the offsite photo announcing a raise, since with every celebration and event post taken out it still comes in at 2.02x.
We would discount video a little, because at 1.18x it does better than text but less than a single good image, and it is the most expensive format to produce. For most teams the better trade is a strong graphic or a set of images on every post that matters, and video only when there is something worth filming.
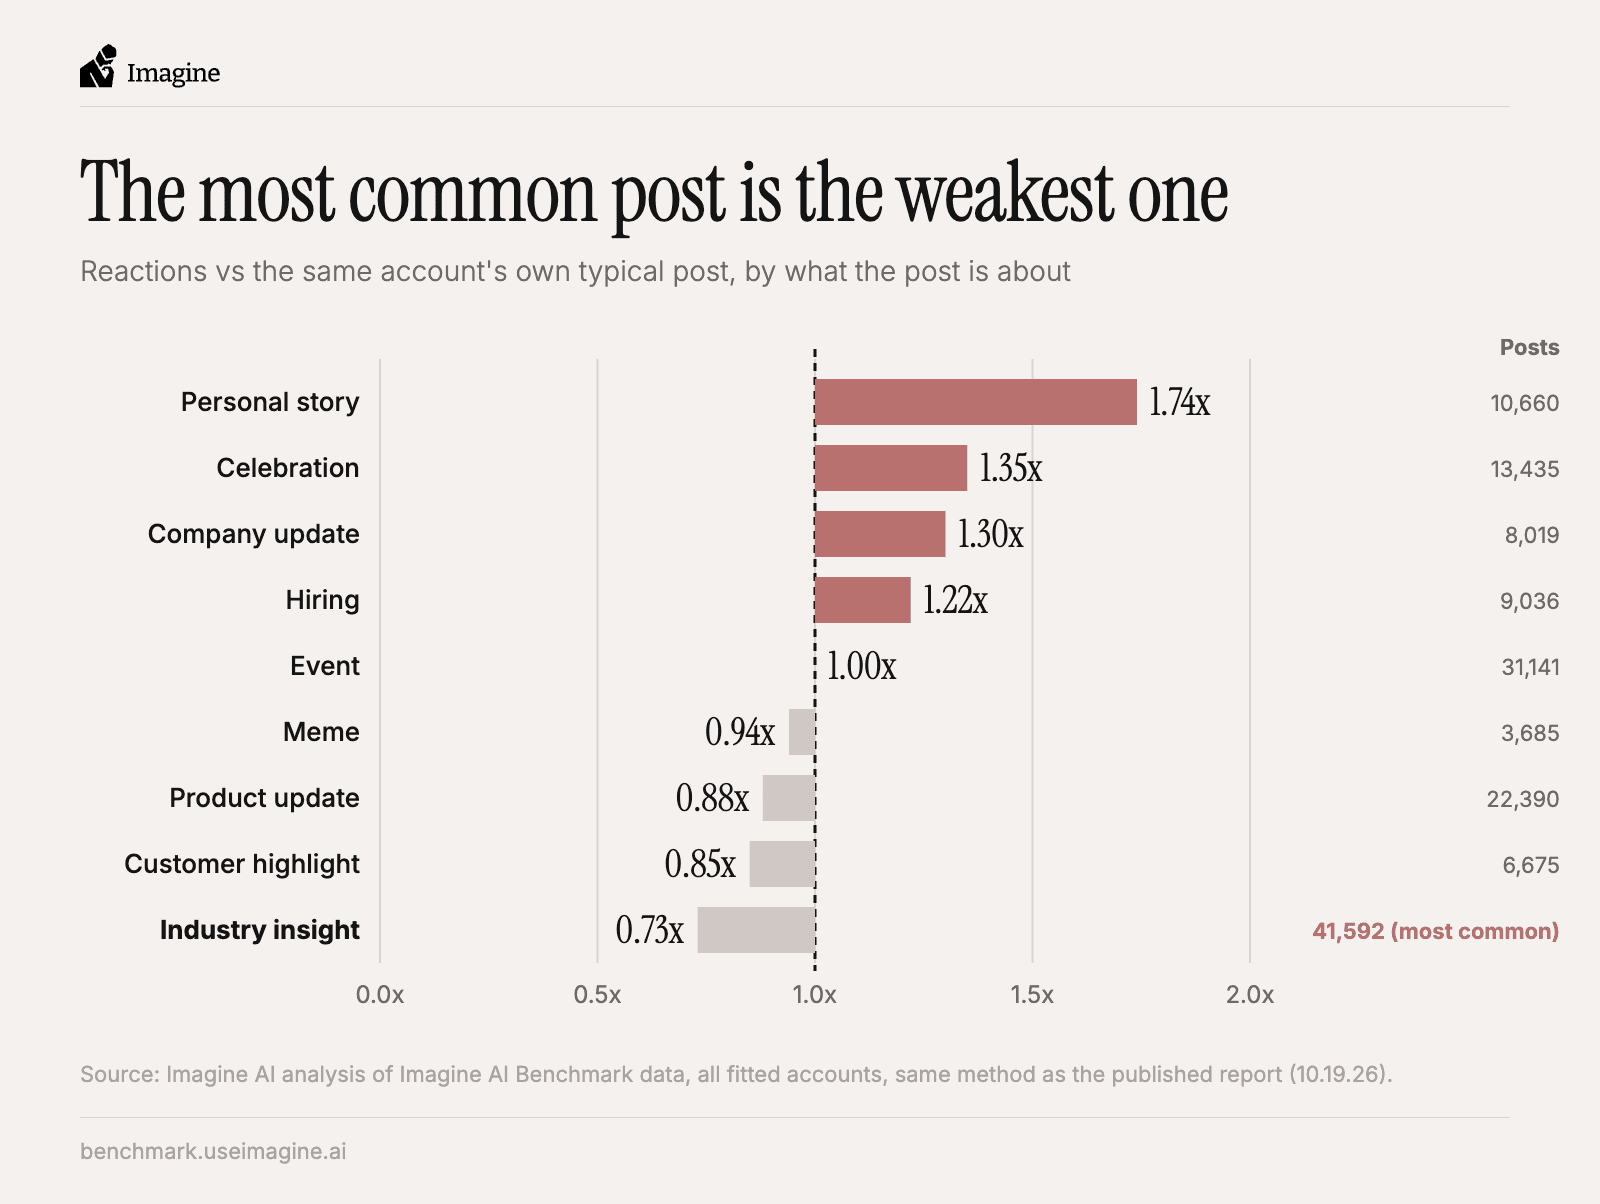
Figure 7: Reactions on a post against the author's own typical post, by what the post is about, as tagged by a language model into one of nine topics. Source: our analysis.
Topic matters just as much, and industry commentary (the "here is my take on where AI agents are going" post) is the most common topic in the dataset at about one tagged post in four while also being the weakest at 0.73x. Personal stories get 1.74x, celebrations like a raise or a milestone get 1.35x, company updates 1.30x and hiring posts 1.22x, while product updates and customer highlights, the two things marketing teams ship most, both come in under 1x. The personal story lift holds within a format as well, at 1.37x among text-only posts and 1.82x among single-image posts. Everybody has a take on the industry, and the posts that do well are the ones only that person or that company could have written.
Filler posts cost momentum
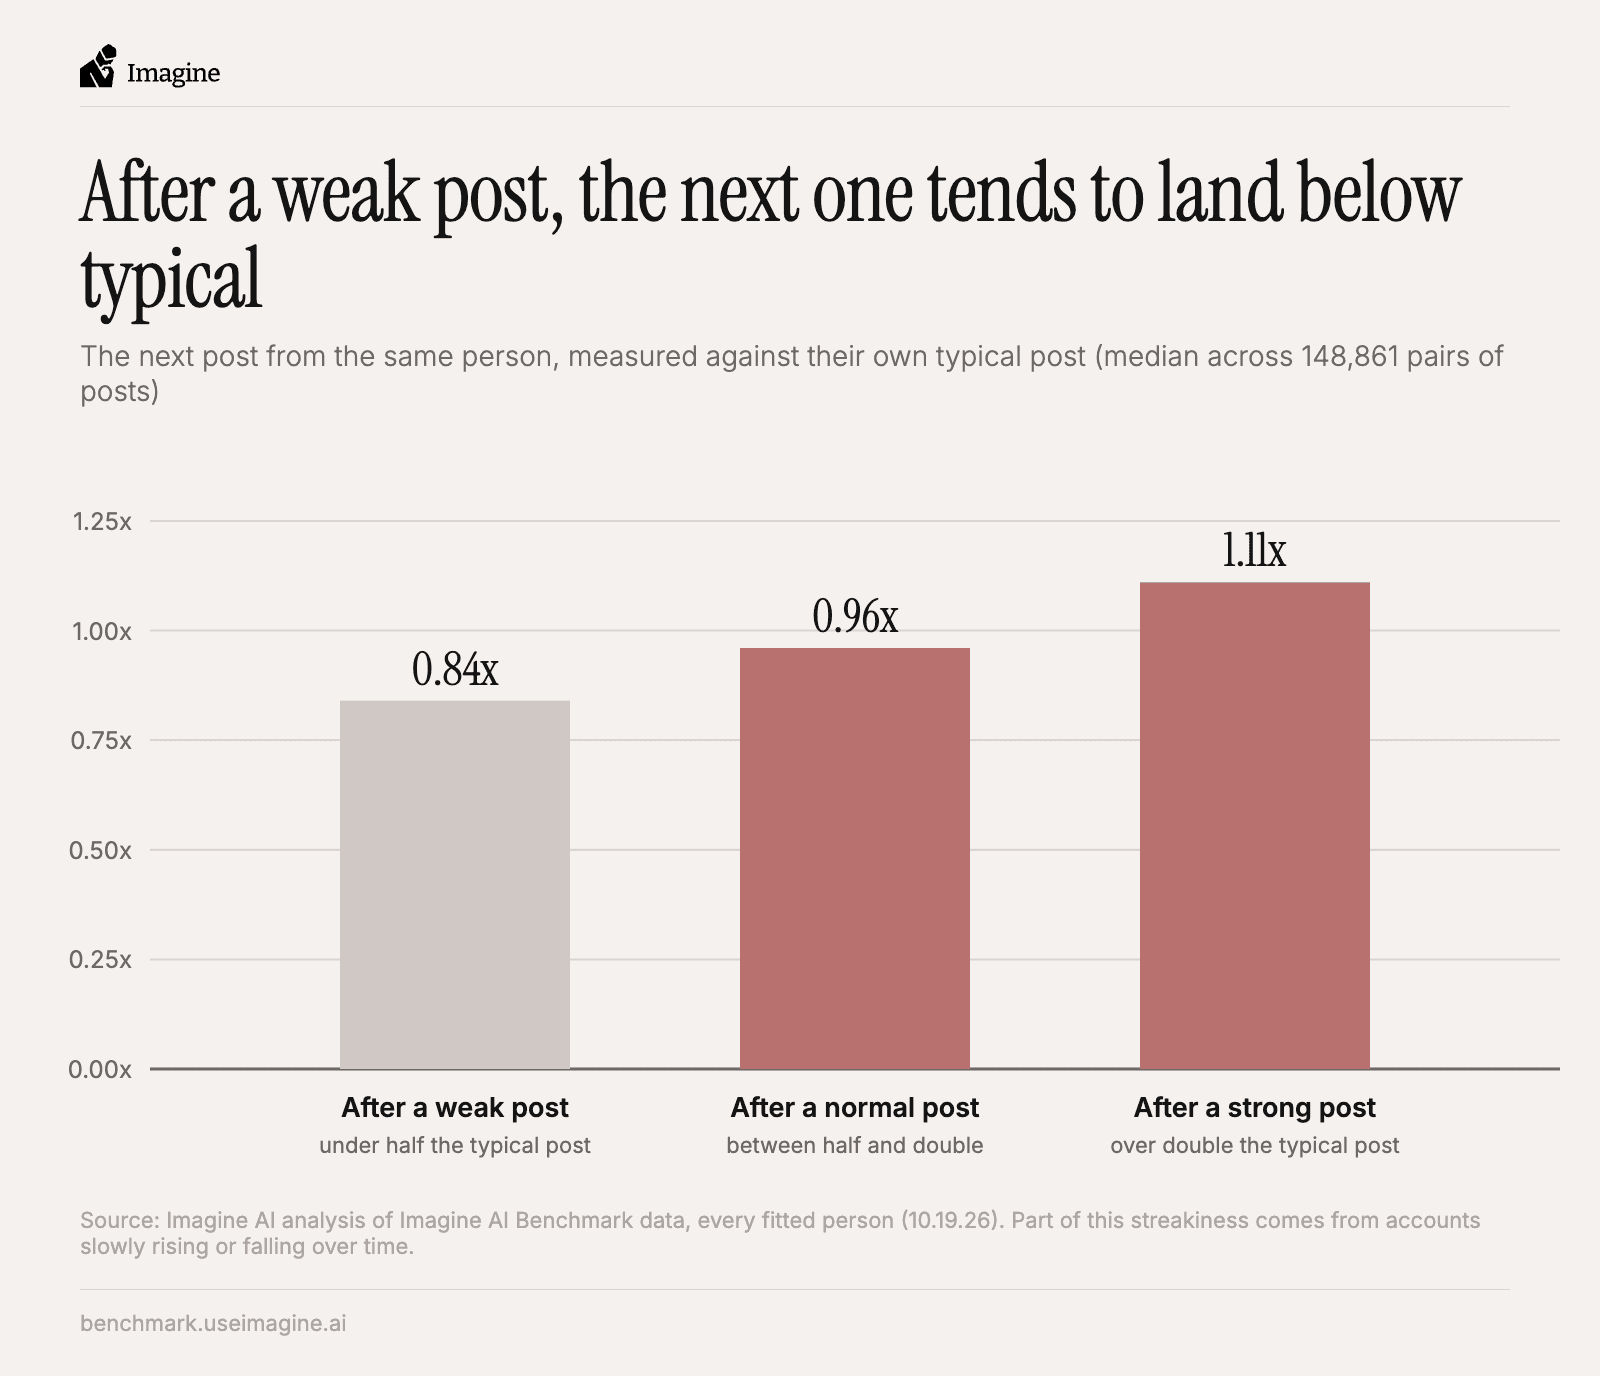
Figure 8: The next post from the same person, measured against their own typical post, split by how the previous post did. Median across 148,861 pairs of consecutive posts. Source: our analysis.
When someone's post does under half of their typical reactions, their next post comes in at a median of 0.84x their typical post, against 0.96x after a normal post and 1.11x after a post that did more than double. Five posts later the effect is still there, at 0.88x against 1.04x. Part of this is that accounts drift up and down slowly over time, so we read it as a pattern in the data and leave open how much of it is LinkedIn's feed. The practical point is the same either way, and it's the main reason we don't think more is always better. Past a few posts a week most people start running out of things worth saying, and a post put out just to hit a quota has a cost.
Two to three posts a week
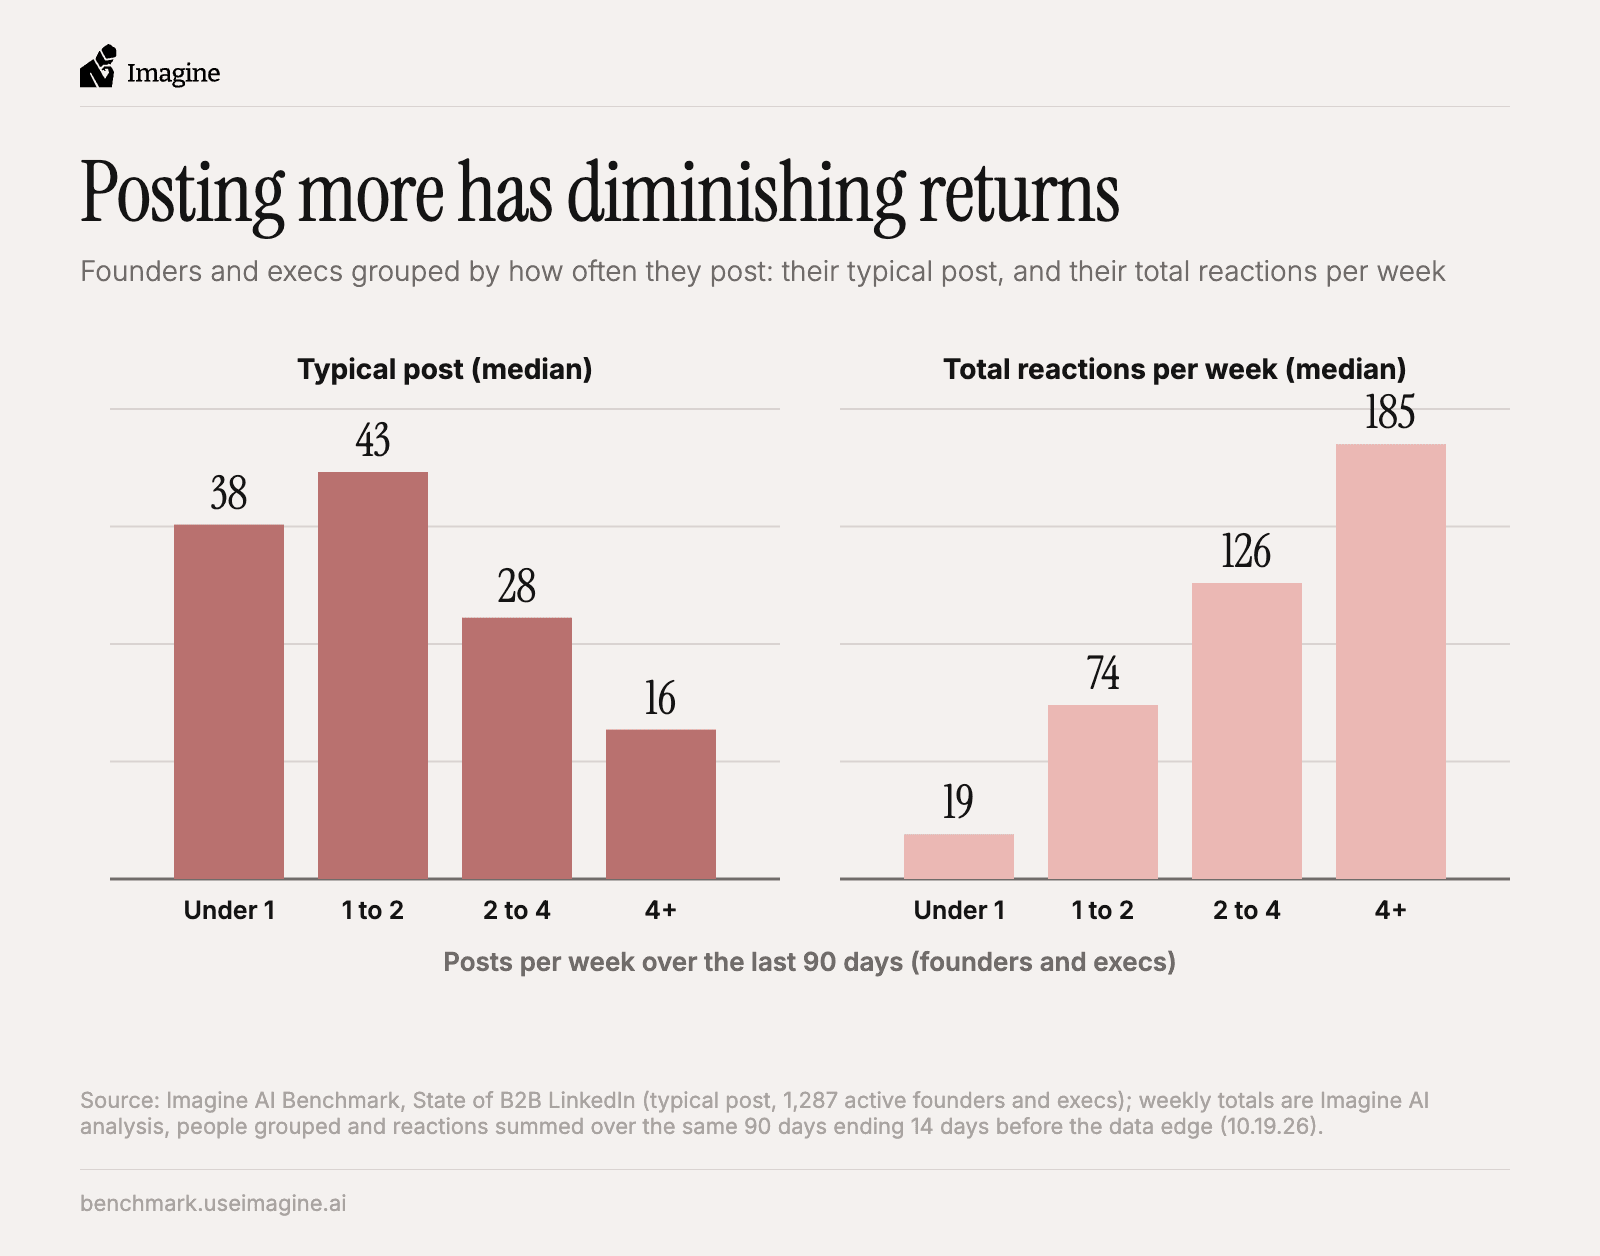
Figure 9: Founders and execs grouped by how often they post, showing their typical post and their total reactions per week. Source: typical post from the published report, weekly totals from our analysis.
An account's typical post peaks at one to two posts a week, at 43 reactions, and falls to 16 for people posting four or more times a week (source). Total reactions per week still rise with volume, from 74 at one to two posts to 126 at two to four and 185 at four or more, so posting more does buy more attention. When we split the two to four group further, people posting two to three times a week get a median of 129 reactions a week with a typical post of about 32. People posting three to four times a week get 95 a week with a typical post of about 23. So we think the best cadence for most people is two to three posts a week. Post less than that and you risk getting lost in the noise, and much more than that and most people start putting out weak posts because they're out of ideas, which Figure 8 shows has a cost.
Industries, and which ones talk to each other
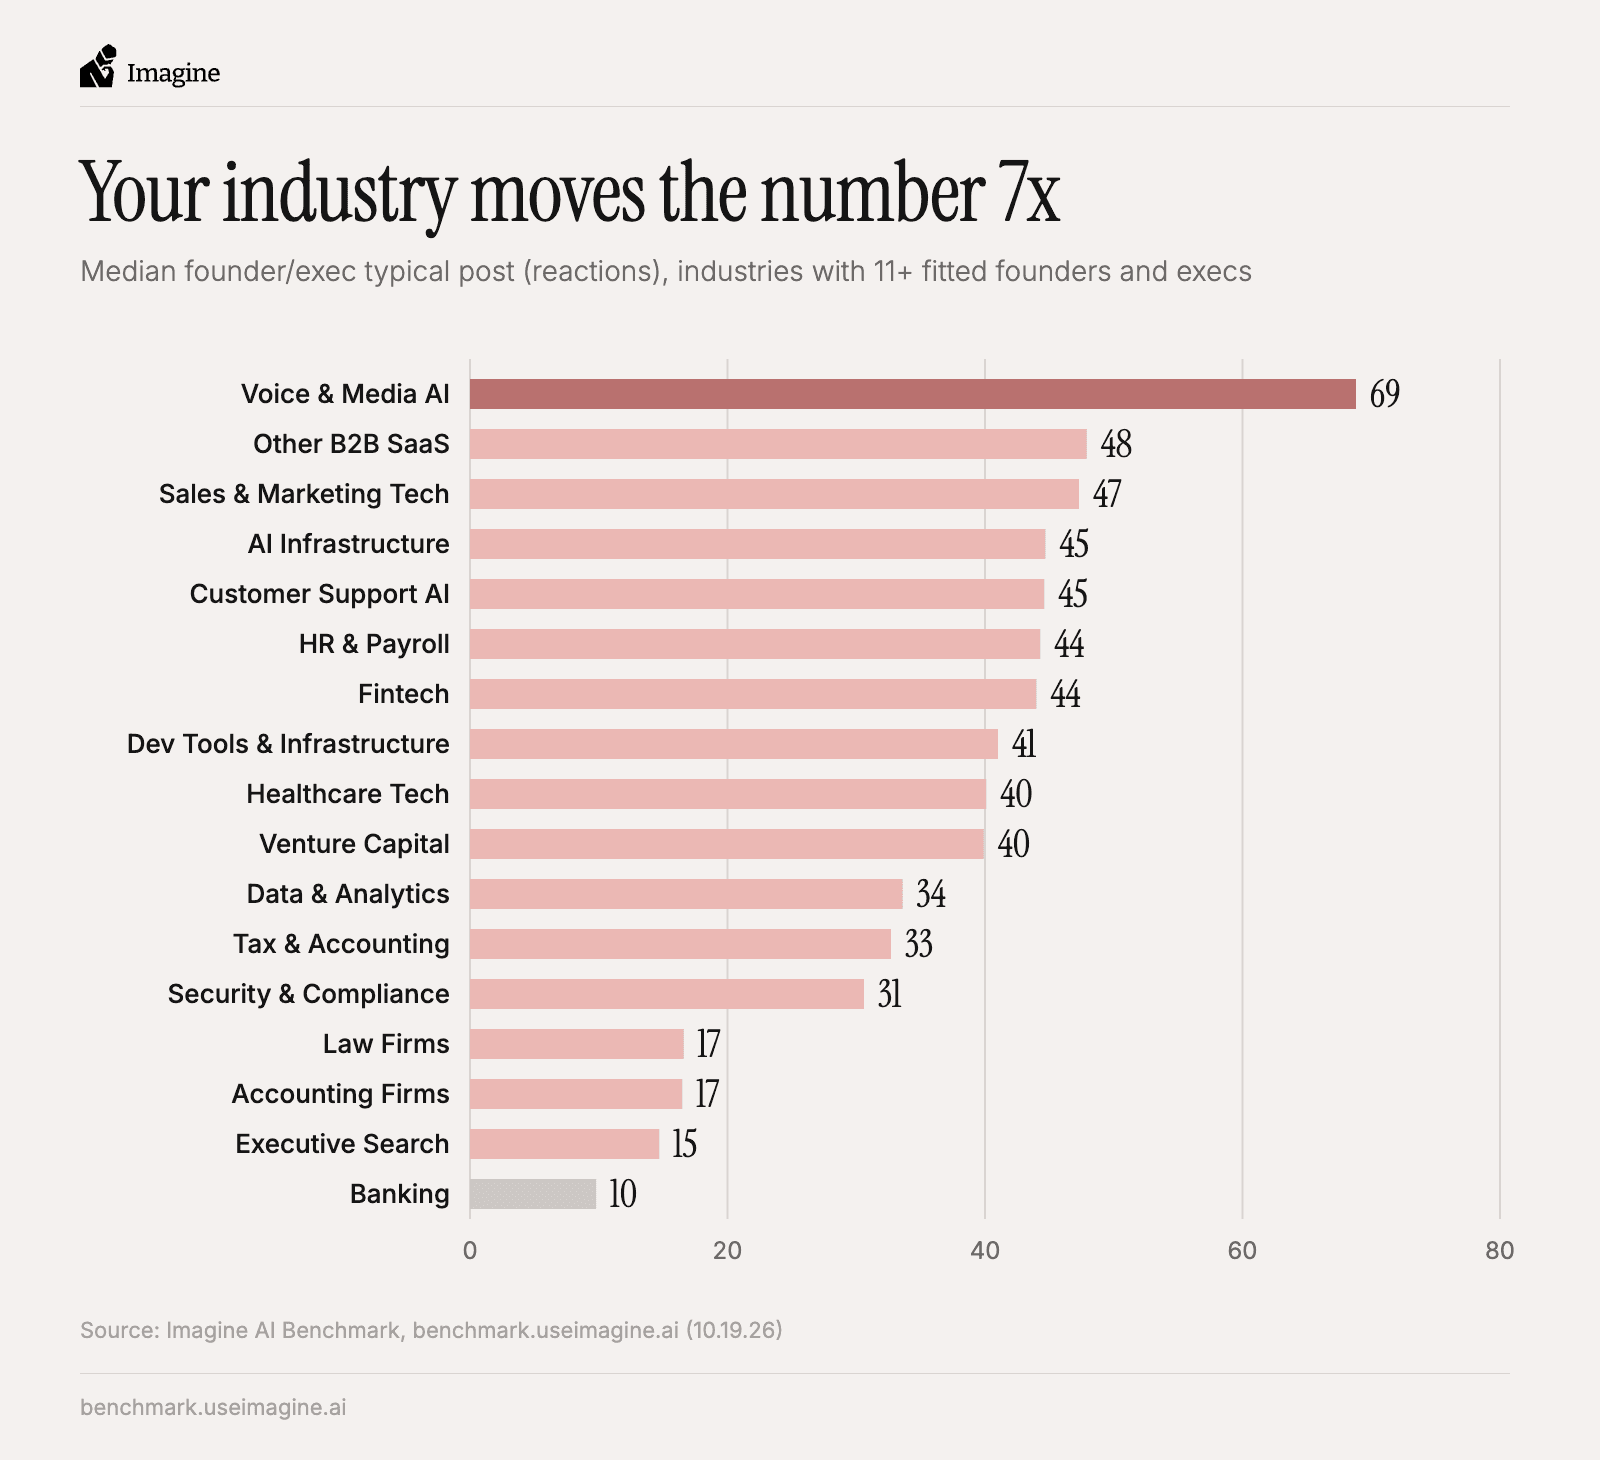
Figure 10: Median typical post of founders and execs by industry, for industries with 11 or more founders and execs we can measure. Source: published report.
The median typical post ranges by industry from 69 reactions in Voice & Media AI to 10 in Banking, though Banking is only 14 execs at four banks (source). Voice & Media AI holds at 69 even with its best-known company taken out, most software sits between about 40 and 48, and professional services sit near the bottom, with law firms at 17. So the right comparison for any team is its own industry. A bank CEO at 25 is doing very well while an AI founder at 25 has work to do, which also means a team in a quieter industry like banking needs far less to stand out from its peers.
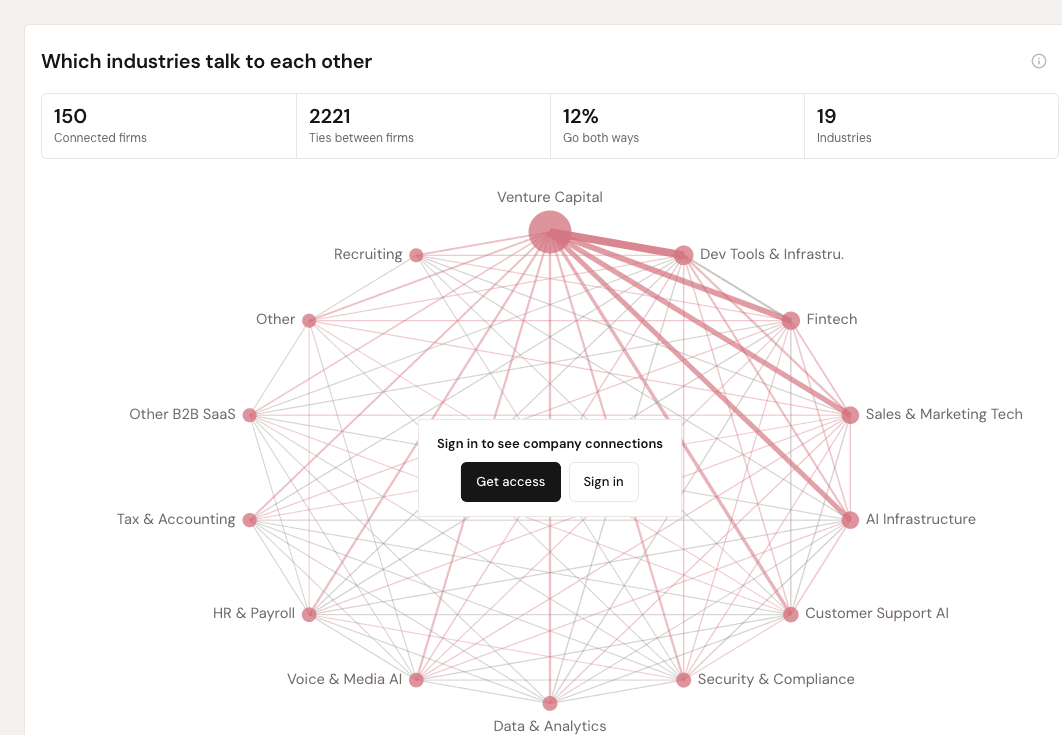
Figure 11: The benchmark's ecosystem view, showing which industries interact with each other through reshares, mentions and shared events over the last 180 days. Company-to-company ties are visible after sign-in. Source:benchmark.useimagine.ai/discover/ecosystem.
The benchmark also tracks how companies touch each other in public, through reshares, mentions and shared events. Over the last 180 days we see 2,221 ties between 150 companies across 19 industries, and venture capital sits at the center of it, with the strongest links between VC firms and dev tools, fintech, sales and marketing tech and AI infrastructure. Only 12% of those ties go both ways, so most of the time one company amplifies another and nothing comes back. The practical takeaway is that this is cheap reach most companies leave on the table. Resharing and mentioning the customers, partners and investors you work with costs almost nothing, and since so few companies return the favor, the ones that do stand out.
How the ranking works
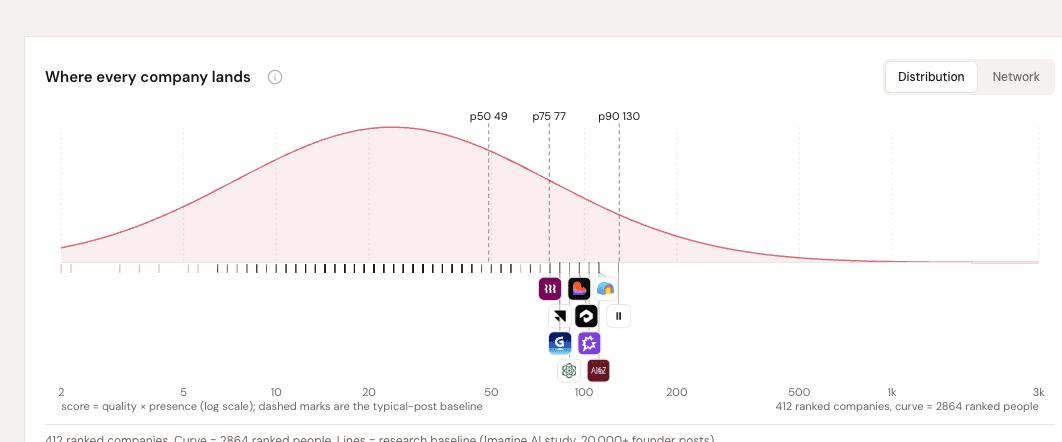
Figure 12: Where every ranked company lands on the benchmark (ticks), against the curve of 2,864 ranked people,ranked on quality times presence, with the YC founder baseline marked at 49, 77 and 130. Source:benchmark.useimagine.ai/arena.
The leaderboard ranks 412 companies on one metric, quality times presence, and it is built around the same view we hold in this piece. Quality is how good a company's typical post is, measured as the median across its page and up to five of its people. Founders, CEOs and C-suite who posted in the last 90 days count first, then the most active, and the number is pulled toward the board-wide average when there are only a few accounts to go on. Presence is how much and how consistently they post. It combines posts per week over the last 13 weeks, with each account-week capped at seven posts so a burst past that buys nothing, and the share of those weeks with at least one post. A company with one great poster and nobody else usually won't rank as well as a company where five people post well every week. We think that's the single most important takeaway in this piece, because five good-enough posters beat one great one, and it's the behavior the data says works. If you want the details, the full method is on the methodology page.
What the best teams have in common
At the top of the leaderboard a few habits show up again and again, and they're repeatable, so any team can build them into how it runs LinkedIn.
-
The whole team posts. At one of the top three companies on the leaderboard, a co-founder and the heads of growth, marketing and sales all post at a top-tier level, so the company itself acts as the channel.
-
The CEO and the C-suite post often and visually. One of the highest-ranked CEOs posts around twice a week, and only about one in ten of those posts is text only, with the rest images and video.
-
Rhythm matters more than raw volume. Another top CEO posts less than once a week, about two thirds of it video, and his company still sits in the top 10% of the board because he posts on a steady rhythm, week after week.
-
A dull category doesn't hold you back. A founder selling accounting software, which few people would call exciting, almost never posts text only, and his company ranks in the top 3% of the board.
-
Marketing leaders post on their own accounts. At more than one top-ranked company the CMO or VP of marketing posts well personally as well as running the company page.
-
Investors are part of it. Venture firms sit at the hub of the ecosystem in Figure 11, and a VC firm is #2 on the leaderboard, with several of its partners posting at a top-tier level. Your investors are one of the best gateways to a broader audience, so they're worth cultivating on LinkedIn too.
What we do with this
This is the playbook we already use with the growth-stage B2B teams we work with. For diversity, we get at least four people posting at least once a month, from at least three departments, with the CEO as one of them. For consistency, each of them posts two to three times a week, every week, so the rhythm holds without bursts. For authenticity, we cut the generic industry takes in favor of the things only that company can say, like the hire, the customer moment, the lesson from building it, or the milestone. For quality, every post that matters gets a strong image or a set of images, video only happens when there's something worth filming, and we skip the filler post when there's nothing worth saying, since it costs momentum.
People also ask how you know it's working. We judge each account by how its own typical post changes over time, against its own industry, and we don't put much weight on the occasional viral post or on other people's results, since both depend on too much outside the poster's control. What we focus on is the day-to-day work of posting authentic, high-quality content consistently, because that's what our data shows to be the repeatable path.
Where this is going
Everything above is measured. This last part is where we think it all leads.
AI has made content and outreach cheap. In July Originality.ai ran its detector over 5,000 public long-form LinkedIn posts and classified 81% as likely AI-written, up from roughly half in late 2024. LinkedIn said in May that it now limits how far generic AI content gets distributed. Figures 6 and 7 are what that looks like in the data, since the cheapest posts to make, plain text and generic industry takes, are both the most common and the weakest. AI makes it easier than ever to create and share low-quality content, but that content doesn't cut through to your audience.
At the same time the reader is changing, with 51% of B2B software buyers in G2's 2026 survey now starting their research in an AI chatbot more often than in Google. The models those buyers rely on are built from what's public on the internet, so the trustworthy, high-quality posts that reach people are also the ones most likely to shape what those models tell buyers.
We think the bigger shift is in how companies work with each other. Highly automated companies produce far more with far fewer people, and companies have always preferred to work with companies like themselves, which AI is likely to speed up. Two AI research papers take that idea seriously. In TASRA (2023), Andrew Critch and Stuart Russell sketch a future where automated companies increasingly buy from and sell to each other, "a collective tendency towards 'closing the loop' on production and consumption by fully automated companies." The Gradual Disempowerment paper (Kulveit et al., 2025) makes a related point about content, warning that "even human creators may primarily cater to AIs as the share of AI consumers of culture grows." Both papers are written as warnings and we read them that way. For B2B marketing, what matters is that more of the reading, sorting and deciding about which companies to work with will run through software, and the companies with a clear, trustworthy public voice are the ones both software and people will find.
But whichever future arrives, companies, automated or not, still need a way to find each other, judge each other and start working together.
Today that layer is LinkedIn. It launched in 2003 as an online resume and contacts network and has kept adding features since. But it still can't tell you how two companies relate to each other.
We want the benchmark to become that measure. Today it measures posts, and the ecosystem view in Figure 11 is the start of something broader: a public measure of how B2B companies communicate outside their own walls, which companies touch each other, and how often and how well they do it. As more of that communication runs through agents on both sides, we think a neutral, open measure of it becomes the authority people check, and we want Imagine AI to be the connective tissue between those companies.
For now, LinkedIn is still the center of how B2B companies connect, and we can't change that overnight. What we can do is help you and your team get heard there with the same four habits this data keeps pointing to, which are diversity, consistency, authenticity and quality, and if you want help putting them into practice we'd love to talk.
Limitations
Most of this is correlation, and reactions are only one signal among many, so keep in mind that they can be gamed and that we don't filter out engagement pods. The company set is curated rather than random; our people coverage is better at companies whose teams already post; and follower counts are only on file for some accounts. The format and topic comparisons measure each account against itself, so audience size can't explain those gaps, but none of this is a controlled experiment.
Check your own company
The benchmark is free to look at, so you can search your company to see where it lands in its industry, or look up your firm and your portfolio if you're an investor. The full report is at benchmark.useimagine.ai/research/state-of-b2b-linkedin, with CSV and JSON downloads, licensed CC BY 4.0 so you can reuse any number or chart with a link. The study behind the method is The distribution of LinkedIn engagement.
Data through Oct 19, 2026. The report refreshes daily, so live numbers may move slightly from the ones here.
Citation
@online{imagineai2026four,
        author = {Sky Yang},
        title = {4 habits to success on LinkedIn: a study of over 1,000 B2B companies},
        date = {2026-10-23},
        year = {2026},
        url = {https://useimagine.ai/blog/four-habits-b2b-linkedin},
}