
The distribution of LinkedIn engagement: A study of Y Combinator founders
In the past few years, LinkedIn has become one of the primary distribution channels for early-stage startups due to its dense professional network. As the demand has grown, a large number of vendors have begun providing similar LinkedIn services along with an increasing volume of thought-leadership articles such as playbooks, growth frameworks, and posting strategies.
However, there is fixed feedback on these articles because the conclusions often rely on personal anecdotes and are difficult to reproduce reliably. Before jumping into any predictive or causal claims, we should first characterize the distribution of engagement to establish a baseline reference. Concretely, what does engagement actually look like for an individual founder's posts, and how does it vary across founders?
In this study, we focused on founders from the Winter 2024 (W24) and Summer 2024 (S24) cohorts of Y Combinator (YC), a reputable accelerator with a large, publicly accessible founder directory. Together, the two cohorts contributed over 20,000 public posts from more than 600 founders within an 18-month window, with roughly equal representation from each cohort.
We found that, for an individual founder's account, post engagement approximates a log-normal distribution. We further modeled each founder with the log-normal distribution — — and found that the fitted parameters fall into the same range for both W24 and S24 founders.
Our study suggests a model for interpreting LinkedIn engagement and a baseline for future comparisons with other populations, allowing more rigorous evaluation of engagement dynamics on LinkedIn. In the following sections, we describe our study design, data collection methods, and results in detail.
Study design
Data collection
In this study, we scraped over 20,000 LinkedIn posts published by W24 and S24 founders between January 1, 2025 and June 30, 2026. For this purpose, we made five sampling choices deliberately:
-
Two cohorts: one for exploration and one for replication.
-
Original posts only: we excluded reposts and quote posts to focus our analysis on author-curated content.
-
Founder personal accounts only: we excluded company pages because company accounts behave differently from personal accounts and pooling them would require more careful treatment.
-
Publication window: we collected 18 months of data while ensuring the start of the window was at least 8 months after W24 Demo Day (3 months after S24 Demo Day) so that any in-batch burst of engagement had dissipated, allowing us to observe a steady-state founder distribution.
-
Collection date: all data was collected on a single day — July 16, 2026 — providing at least 2 weeks for all the post engagement to accrue and stabilize.
We collected the listed LinkedIn URLs from all the founder profiles in the YC startup directory, which yielded 477 and 480 identifiable accounts for W24 and S24, respectively. Scraping every post inside the publication window gave 11,116 posts from 307 W24 accounts and 9,489 posts from 307 S24 accounts.
Quantifying engagement
In this study, we used reaction count as the metric to quantify post engagement because it is publicly available, simple, and interpretable.
We also explored using the number of impressions, comments, reposts, or a composite metric to quantify engagement. However, impressions are not publicly available for scraping; both comments and reposts are zero (or near zero) for the majority of posts, leaving too little variation to support meaningful comparisons; and a composite metric introduces unnecessary researcher degrees of freedom given that our study focuses on large-scale distributional shapes.
Hold-out replication
To prevent overinterpreting noise within a single sample, we explored the W24 data and held out the S24 data for replication. If a finding replicates in the hold-out dataset, we can be more confident that it reflects a genuine pattern.
Results
Note that all the analyses and results are presented in log space.
To get an intuition about the data, we started by pooling all the post reactions naively. This produces a near-log-normal distribution with a median of 48, a of 508, and a maximum of 10,313, where the top 5% of the posts capture roughly half (47.7%) of the reactions while the bottom half contribute only 8.75%.
However, this raises the question of whether this is a universal distribution that underpins every founder or a result of mixing different founders. To separate the effect of "who" is posting versus "what" is posted, we need to analyze each account's data individually.
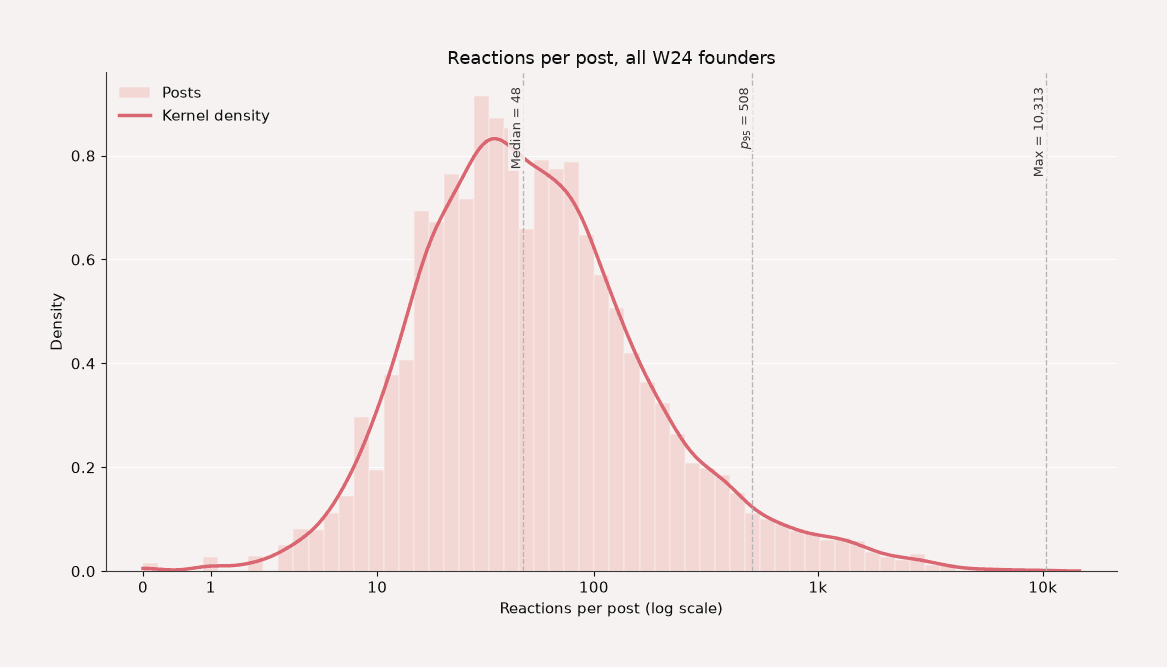
Figure 1: Reaction counts pooled across all 11,116 W24 founder posts, resembling a log-normal distribution with a median of 48 and a of 508.
Every account's engagement resembles the same distribution
To ensure we had enough sample size per account, we restricted the analysis to accounts with at least 18 posts published in the window, i.e., roughly one post per month on average. This gave us 138 of the 307 accounts (45%) that published in the window. It also reduced the total number of posts from 11,116 to 10,177.
To compare each account's posts on the same scale, we standardized the post reaction counts by subtracting the author account's mean and dividing by the account's standard deviation in log space. This shows us how each post performs relative to that account's average. When we visualized each account's standardized density, we found that the curves track a standard normal distribution closely with a small positive skew.
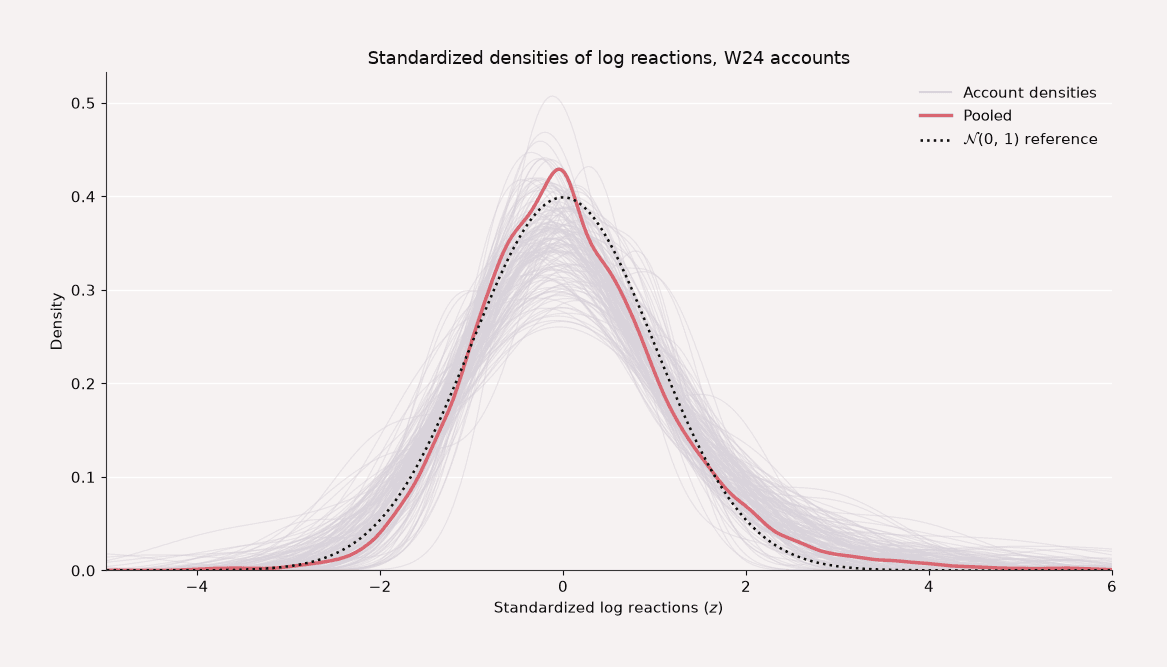
Figure 2: Densities of standardized log reactions for 138 W24 accounts with 18+ published posts overlaid with a standard normal reference.
Indeed, numerous prior studies have found that some social media engagement data follows a log-normal distribution1, and our study reinforces this observation. One could argue for a closely related variant instead (a skewed alternative, or one with a Pareto tail), but for the sake of establishing a baseline understanding, we used a simple log-normal model to describe the data.
After fitting a log-normal distribution — — to each account, we found that and are also roughly normally distributed. Selected percentiles of :
| Percentile | Log scale () | Linear scale |
|---|---|---|
| Median () | 3.89 | 49 |
| 75th () | 4.34 | 77 |
| 90th () | 4.98 | 145 |
For within-account variance, the fitted log-normal parameter also shows consistency across accounts. In particular, for a typical account, 68.3% of the posts land between roughly half and double its median number of reactions, i.e., :
| Percentile | Spread () | |
|---|---|---|
| 25th () | 0.65 | 1.92x |
| Median () | 0.74 | 2.10x |
| 75th () | 0.85 | 2.34x |
We further tested the correlation between and and found essentially no monotonic relationship (Spearman's , ).
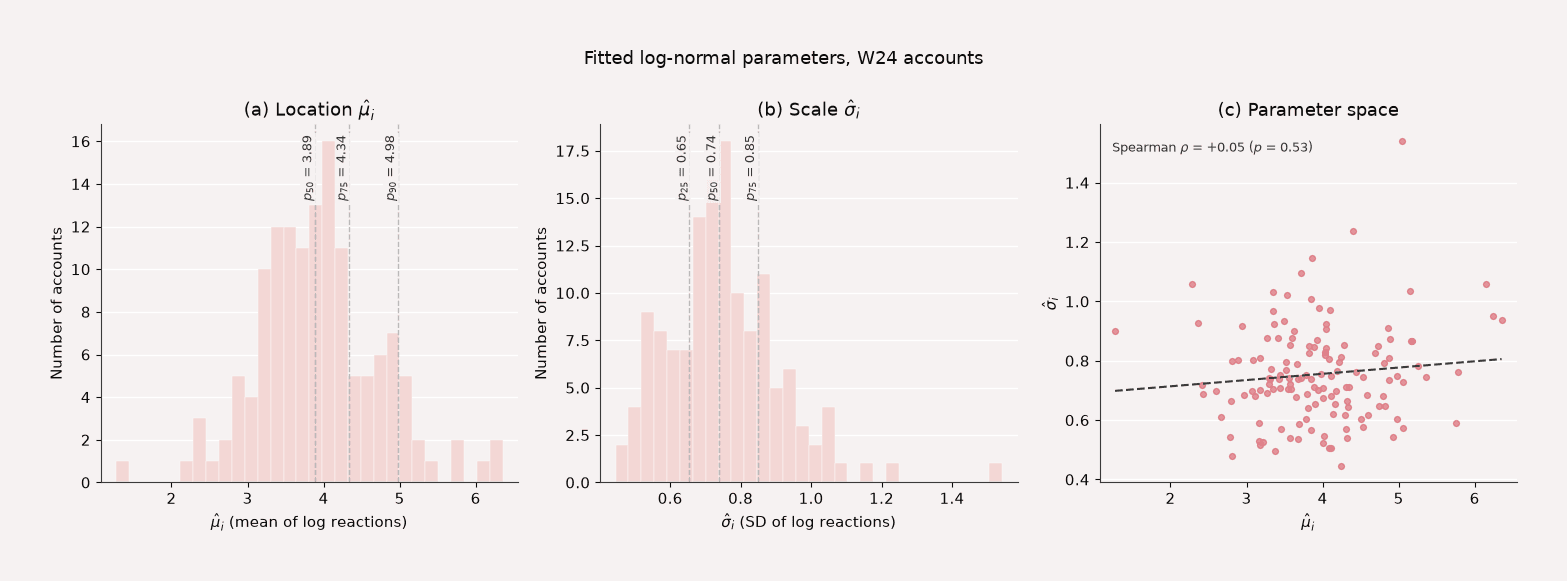
Figure 3: Fitted log-normal parameters and for all 138 W24 accounts and their Spearman correlation in a scatter plot.
Replication in S24
Applying the same process as for W24, we started by pooling all post reactions across accounts, which yields a near-log-normal distribution with summary statistics closely aligned with W24's:
| Posts | Median | ||
|---|---|---|---|
| W24 | 11,116 | 48 | 508 |
| S24 | 9,489 | 42 | 377 |
Standardizing each post's reactions as before, we overlaid the standardized densities and found that they also track a standard normal distribution with a small positive skew. More importantly, the combined standardized distribution from S24 parallels that of W24 almost exactly as shown in Figure 4.
Using the same simple log-normal model, we fitted the parameters and for every account in S24 and found that they fall into the same range as those in W24:
| W24 | 3.89 (49) | 4.34 (77) | 4.98 (145) |
| S24 | 3.86 (47) | 4.33 (76) | 4.79 (120) |
| W24 | 0.65 (1.92x) | 0.74 (2.10x) | 0.85 (2.34x) |
| S24 | 0.66 (1.93x) | 0.75 (2.10x) | 0.90 (2.46x) |
We further tested the correlation between and and found Spearman's . This is consistent with W24's , showing effectively no monotonic correlation.
Our replication shows that all the findings from W24 carry over to S24, including the overall engagement statistics, each account's standardized density, and the range of the fitted parameters. It provides evidence that our results reflect a genuine pattern rather than an artifact of a single sample.
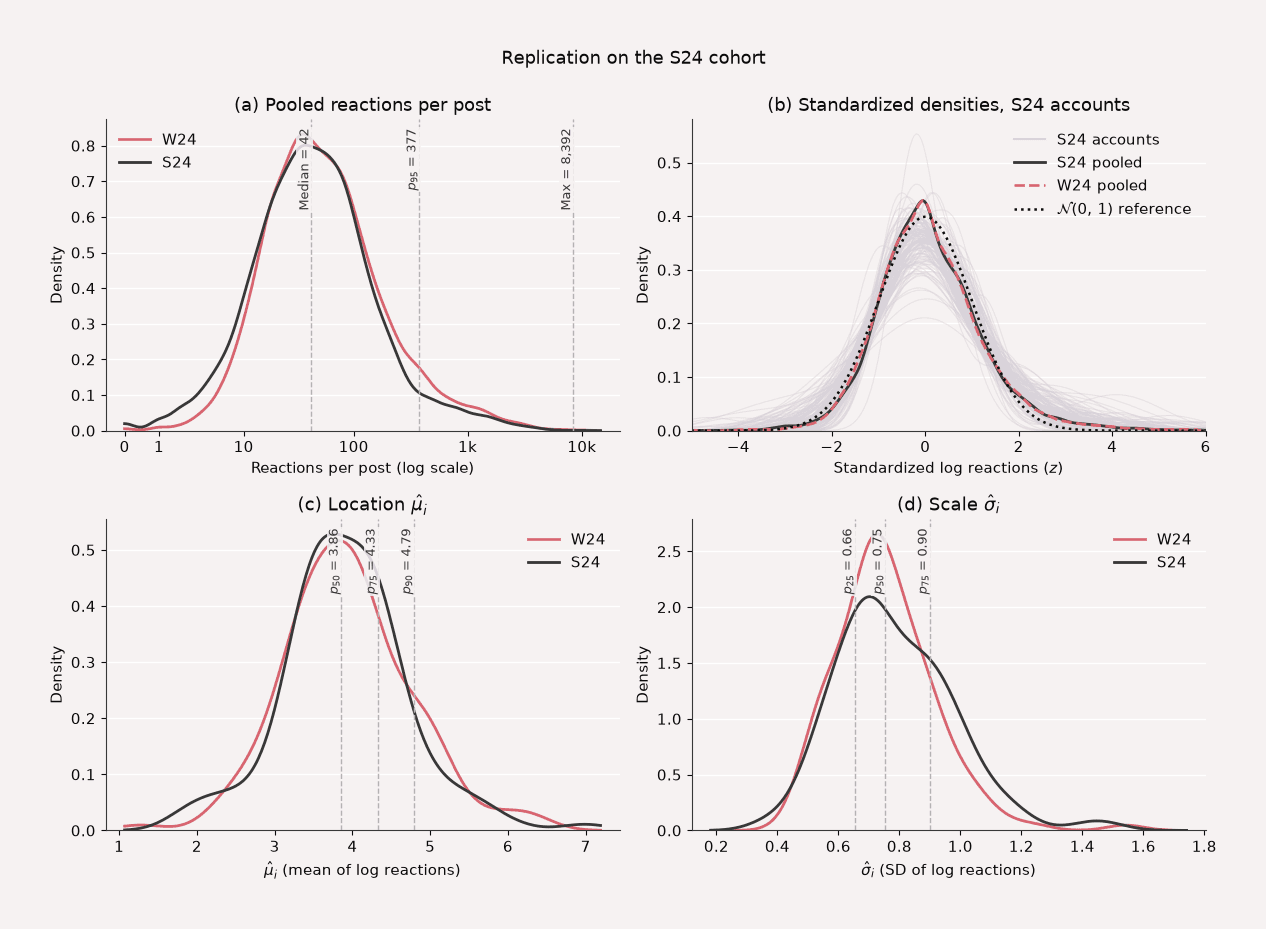
Figure 4: S24 replication of the W24 analyses — pooled reactions, standardized densities, and fitted and — overlaid with the W24 distributions.
Conclusion
In our study, we found that each YC founder's engagement closely follows the log-normal distribution, a distribution that commonly shows up in places where outcomes are the product of many small multiplicative effects, such as stock prices, firm sizes, or income. This suggests that LinkedIn engagement within an account arises from a multiplicative process: a post's final reaction count may be the product of the author's network size, the algorithmic distribution triggered by early reactions, the reach gained through resharing into adjacent networks, and other factors. If LinkedIn engagement indeed arises from this type of process, the obvious next question is: what are the key contributing factors?
Furthermore, by modeling each account's engagement with a log-normal distribution — — we found that the fitted parameters fall into the same range for both W24 and S24 founders. Industry analyses of YC cohorts suggest composition is relatively stable between neighboring batches. It is therefore plausible that this homogeneity drives the similarity in fitted parameters, reflecting the YC selection process, and that the fitted parameters can serve as a baseline for YC founders.
While these findings provide important insights, one limitation is that a single log-normal model fitted across an 18-month window does not account for engagement trends over time. LinkedIn also replaced its production feed ranker during our observation window, a change the company reports lifted likes, comments, and reshares by about 3.5%, albeit small next to the roughly 2.10x within-account spread we measure. We briefly explored cohort-wide trends during the study and found no systematic drift besides idiosyncratic patterns in a small subset of accounts, but even so these effects are negligible in comparison to the consistently high within-account variance. Nonetheless, a more targeted analysis within these outliers to examine longitudinal trends versus the broader sample would be worthwhile.
Citation
@online{imagineai2026distribution,
        author = {Neo Lee},
        title = {The distribution of LinkedIn engagement: A study of Y Combinator founders},
        date = {2026-08-28},
        year = {2026},
        url = {https://useimagine.ai/blog/the-distribution-of-linkedin-engagement},
}